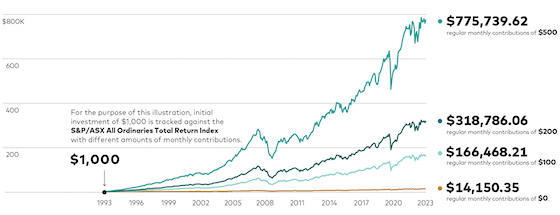
How regular investments turned $1,000 into $775,000
A simple ongoing investment strategy can deliver substantial returns over the long term.
The Australian share market, when measured by the broad S&P/ASX All Ordinaries Total Return Index, has delivered an average annual total return of 9.2% since mid-1993.
Thirty years ago, Australia was still emerging from the economic downtown that then prime minister Paul Keating had famously described as “the recession we had to have” when he had held the role of treasurer in 1990.
Having been as high as 17.5% in 1990, official interest rates had been cut back aggressively to 5.25% by early 1993 to help stimulate economic growth. The rate cuts also bolstered returns on the Australian share market.

If an investor had invested $1,000 into the broad Australian share market on 1 July 1993 and done nothing other than reinvest the company income distributions they had received, their investment would have achieved a total return of 18.6% and increased to $1,184 by 30 June 1994. The numbers exclude investment fees or taxes.
And if that $1,184 investment balance was just left alone for the next 29 years, aside from reinvesting the income distributions received over time, it would have grown to $14,150 by 30 June 2023. That’s a huge total compound return of more than 1,300%.
But it’s nowhere near as big a return as it would have been if an investor had followed a simple regular investments strategy over the same period.
How regular investments add up
Source: Vanguard.
Notes: Data based on S&P/ASX All Ordinaries Total Return Index between 1 July 1993 and 30 June 2023. Assumes all income distributions reinvested. Excludes investment fees or taxes.
Adding $100 per month
Just by adding $100 per month, the initial investment of $1,000 on 1 July 1993 would have compounded to more than $166,000 by 30 June 2023. That’s based on the total return of the Australian share market, the addition of regular investments, and the reinvestment of all distributions.
In other words, by making $36,000 in additional $100 monthly investments into the Australian share market over 30 years, a $1,000 initial investment would have been worth over $150,000 more than the $14,150 balance if no extra contributions had been made.
The numbers, which assume you incurred no investment management fees, indirect costs, or buy/sell spreads, would have become even larger if higher regular monthly investments had been made.
Adding $200 per month
By adding $200 per month to the initial $1,000 amount an investment in the Australian share market, once again based on the performance of the S&P/ASX All Ordinaries Total Return Index, would have grown to more than $318,000.
That’s a $73,000 total investment (the initial $1,000 plus $72,000 in additional investments) over 30 years to achieve an investment worth $300,000 more than the $14,150 balance if no additional investments had been made.
Adding $500 per month
A regular investments strategy of $500 per month over 30 years ($180,000 in total) would have turned the initial $1,000 investment into more than $775,000 by 30 June 2023.
Here’s how the investment balance numbers would have looked at different points in time based on the actual performance of the S&P/ASX All Ordinaries Total Return Index from 1 July 1993 to 30 June 2023.
The benefits of regular contributions
|
Date |
$0 contributions |
$100 per month |
$200 per month |
$500 per month |
|
1 July 1993 |
$1,000 |
$1,000 |
$1,000 |
$1,000 |
|
30 June 1998 |
$1,864 |
$9,819 |
$17,773 |
$41,653 |
|
30 June 2003 |
$2,515 |
$19,721 |
$36,928 |
$88,549 |
|
30 June 2008 |
$5,461 |
$50,798 |
$96,135 |
$232,147 |
|
30 June 2013 |
$6,086 |
$63,839 |
$121,593 |
$294,853 |
|
30 June 2018 |
$9,927 |
$111,710 |
$213,493 |
$518,841 |
|
30 June 2023 |
$14,150 |
$166,468 |
$318,786 |
$775,739 |
Source: Vanguard. Returns based on S&P/ASX All Ordinaries Total Return Index. Assumes the reinvestment of income distributions and does not take into consideration investment management fees, indirect costs, and buy/sell spreads. Past performance information is given for illustrative purposes only and should not be relied upon as, and is not, an indication of future performance.
It’s only when you compare the numbers in the table side by side that the full picture becomes much clearer.
An initial contribution amount combined with a regular investment savings strategy and the reinvestment of income distributions over time can deliver much higher long-term compound returns.
In the examples used above, there would have already been a significant returns gap after just five years (by 1998) between investors who had not made regular investments versus others that had.
That gap would have kept widening over time. After 10 years investors who had followed a $100 per month regular investments strategy would have had a balance more than five times greater than someone who had not made additional investments but had just reinvested their income distributions. By 2023 the balance differential would have widened to almost 12 times.
On regular investments of $200 per month, the balance gap would have been 22 times by 2023, and based on regular investments of $500 per month it would have been almost 55 times.
Understanding dollar-cost averaging
There’s another major advantage in making regular investment contributions, which brings into play the portfolio strategy known as dollar-cost averaging.
You may not realise it, but you’re probably already undertaking this strategy (indirectly) if you’re a member of a public offer superannuation fund.
Here’s an example of how dollar-cost averaging works in this instance. Every time your employer makes a contribution into your super fund account it’s automatically invested by your super fund according to the default investment strategy that you’ve chosen.
Behind the scenes your savings are most likely being allocated to different managed funds, which invest into shares, bonds, cash, and other types of assets.
While the amount of super your employer pays doesn’t change, your investment purchasing power does change every time you receive a new super contribution.
That’s because the prices of the managed fund units your super fund is investing into does change every day.
If those managed fund unit prices have risen since your last contribution, then your super fund will be purchasing fewer units than last time. Likewise, if the managed fund unit prices have fallen in value, your super fund will be purchasing more units than last time.
This strategy works in exactly the same way if you make regular contributions at set intervals outside of your super to buy units directly in other managed funds and exchange traded funds (ETFs).
You’ll automatically buy more units when market prices are lower and fewer units when prices are higher. Over the total period that you keep investing, your average entry cost into specific assets will potentially be lower than if you’d try to guess the best time to buy in.
As your unit balance grows over time, your corresponding distributions via company dividends and other payments will also keep on growing. That’s the magic of compounding investment returns.
Just like your super contributions, it’s all really about sticking to a disciplined, non-emotional approach to investing that’s not affected by what’s happening on financial markets at any point in time.
Making regular contributions, and taking advantage of dollar-cost averaging, really adds up.
They’re a powerful combination in helping you to focus on achieving your investment goals, ideally through an appropriately diversified portfolio, to give you the best chance of investment success over the long term.
Source: Vanguard August 2023
This article has been reprinted with the permission of Vanguard Investments Australia Ltd. Copyright Smart Investing™
Vanguard Investments Australia Ltd (ABN 72 072 881 086 / AFS Licence 227263) is the product issuer. We have not taken yours and your clients' circumstances into account when preparing this material so it may not be applicable to the particular situation you are considering. You should consider your circumstances and our Product Disclosure Statement (PDS) or Prospectus before making any investment decision. You can access our PDS or Prospectus online or by calling us. This material was prepared in good faith and we accept no liability for any errors or omissions. Past performance is not an indication of future performance.
© 2024 Vanguard Investments Australia Ltd. All rights reserved.
Important:
Any information provided by the author detailed above is separate and external to our business and our Licensee. Neither our business nor our Licensee takes any responsibility for any action or any service provided by the author. Any links have been provided with permission for information purposes only and will take you to external websites, which are not connected to our company in any way. Note: Our company does not endorse and is not responsible for the accuracy of the contents/information contained within the linked site(s) accessible from this page."

